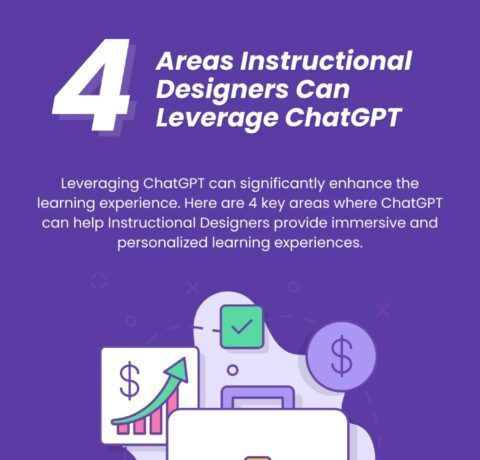
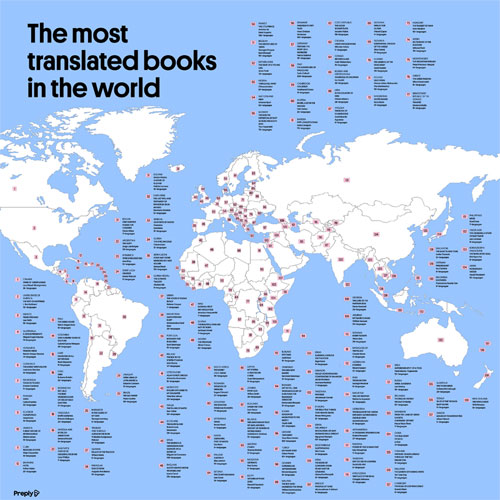
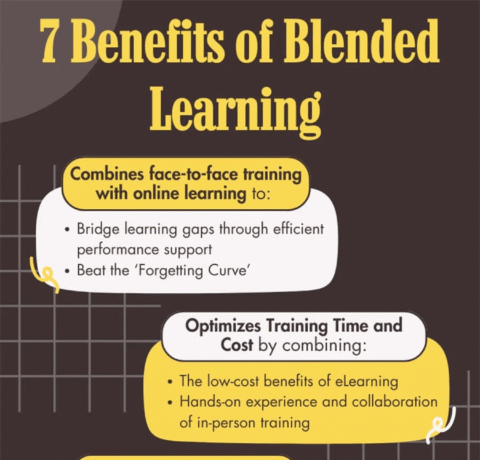
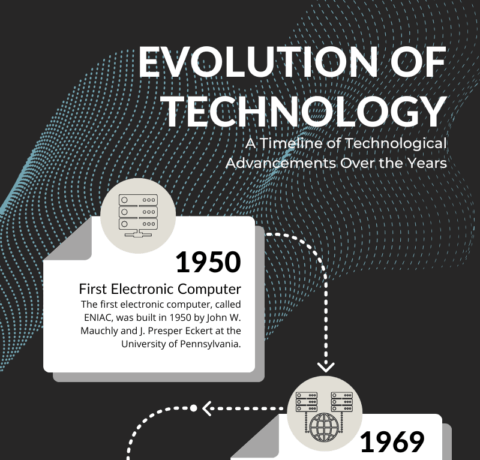
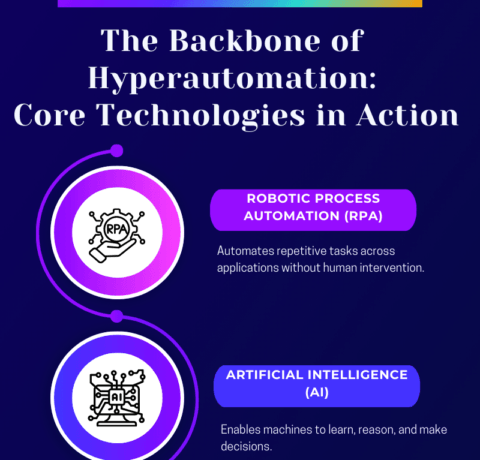
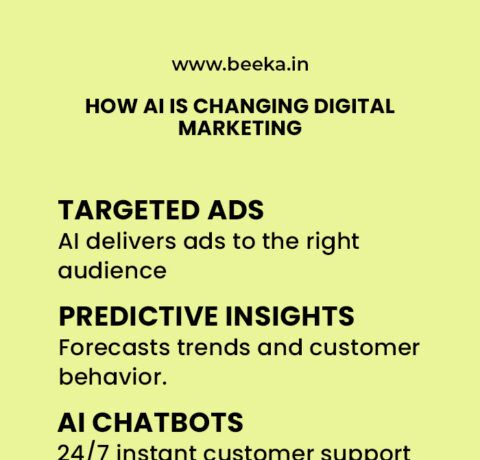
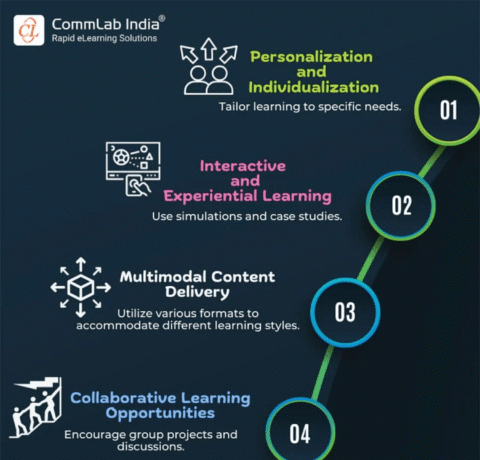
Infographic Home » Visual Zone » Infographic A visually engaging infographic about education or society Filter Sort by: Default Newest First Oldest First A - Z Z - A No matching posts found. Infographic October 8, 2025 التردّد في تلقي لقاح كورونا – Arab Barometer Infographic October 8, 2025 How AI Is Changing Digital Marketing Infographic October 7, 2025 2021 النساء في قوة العمل – Arab Barometer Infographic October 6, 2025 الحريات في الشرق الأوسط وشمال إفريقيا في زمن كوفيد-19 – Arab Barometer Infographic October 6, 2025 قياس النبض الليبي 2022 Infographic October 6, 2025 قياس النبض المغربي 2022 Infographic October 6, 2025 التنافس بين الولايات المتحدة الأمريكية والصين في الشرق الأوسط وشمال أفريقيا Infographic October 6, 2025 النوع الاجتماعي في الشرق الأوسط وشمال أفريقيا 2022 – Arab Barometer Infographic October 6, 2025 النساء في قوة العمل 2022 – Arab Barometer Infographic September 30, 2025 8 Instructional Design Strategies – e-Learning Infographics Infographic September 26, 2025 AI Agent Tech Stack Development [Infographic] Infographic September 25, 2025 How Can Instructional Designers Leverage ChatGPT? Infographic September 25, 2025 Charting the World’s Most Translated Books Infographic September 17, 2025 7 Benefits Of Blended Learning Infographic September 10, 2025 Best Practices For Using ChatGPT In Instructional Design Infographic September 2, 2025 The Evolution Of Technology – e-Learning Infographics Infographic August 6, 2025 Automation Evolved: Core Technologies Driving The Future Infographic July 29, 2025 Java Vs. Python: Which One Should You Learn?

![AI Agent Tech Stack Development [Infographic]](https://dr-alfailakawi.com/wp-content/uploads/2025/09/AI-Agent-Tech-Stack-Development-Infographic.jpg)